Exclusives

M&E Journal: Opportunities for Linear Television Using Data Science
Story Highlights
By Sebastian Souyris, VP Data Science, RSG Media –
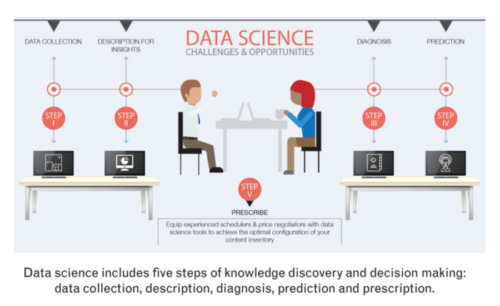
You might be asking yourself, what is data science? In recent years, data science has become rather trendy and can mean many different things to so many different people. Let’s start by agreeing on a definition. Data science is a set of skills and tools that blend several areas of knowledge. It is driven by the ever-growing amount of data that, of course, is accompanied by its associated challenges and opportunities. Data science includes five steps of knowledge discovery and decision making: (1) data collection, (2) description, (3) diagnosis, (4) prediction and (5) prescription. With the completion of each step, the level of value and difficulty increases. Moreover, each step is a building block for the next and provides retroactive feedback to the previous step. These steps combine fundamental sciences such as mathematics and economics, with applied areas like statistics, operations research, and computer science, and subfields such as math programming and machine learning.
Data science is an evolving branch of knowledge that is compelled by today’s challenges: from retail management to financial engineering, geo-location marketing to modern neuroscience. Data science enables businesses and people across the globe to connect and communicate in ways like never before. In the business of television, there are numerous opportunities for using data science to create a competitive advantage.
Data science is vital for the television business, or any business for that matter, to increase the bottom line. To reach this goal, you want to boost your audience and extract maximum revenue from the advertiser. You want to have the perfect mix between original and acquired content; to forecast your audience accurately; to schedule programs, ads and promos better; and you want to price audience inventory to the maximum level that the advertiser is willing to pay while considering competition. Using these five steps, data science solves these problems and can take your network to the next level. Walk with me as we explore the challenges that networks face and learn how each step within data science can help media companies with the future of television.
Step I. Data collection
Today, people watch content in many ways, and each way generates actionable data. The main data provider for television is Nielsen. Nielsen measures viewing patterns from a representative sample of households for all networks using the people meter. But today, viewers have many more options than just watching traditional television. New channels such as Hulu, Netflix, Apple TV and You- Tube give consumers content wherever and whenever they want and on the platform of their choosing. To understand your viewers on a deeper level and your potential market, all of these data sources must be mashed together in an efficient data repository. In real time, the data repository must be updated and it must make data available for actionable analytics.
Therefore, the first step is to design a data repository that is scalable to a growing amount of data, and to connect all data sources. The data repository must be able to ingest and extract stored data quickly and in real time. It must analyze and be adaptable to both structured (e.g., numbers, strings) and unstructured data (e.g., social media generated content, articles, images, videos).
Step II. Description for Insights
Let’s assume your data repository is in place. Now, you can monitor all your relevant audience metrics. You can create powerful visuals and clean reports based on different levels of time aggregation and audience segment.
You must also monitor your competition. You can now get precise viewer migration statistics showing the number of viewers that came from the previous program, viewers that came from competitor programing and the viewers that were not previously watching television at all.
This level of insight gives networks the ability to view hidden patterns that result in better analysis and decision making.
 Step III. Diagnosis
Given the full description of viewing patterns, this step empowers your network to understand why viewers watch what they watch. Data science analyzes why some shows are under-performing, while others are over performing.
Each show is characterized by a series of metadata, combined with the audience history per segment on all networks where shows have been aired. With that, a statistical model is developed that weighs each feature at each daypart, per network and segment.
At any given moment in the day, there are thousands of different people watching. Therefore, a show may over perform in a given time slot, but under-perform in another. A statistical model allows you to understand why. For example, knowing whether fiction or drama performs better with females ages 18 to 34 at prime time is now a necessity.
At the commercial level, you want to understand what commercials retain audiences, and what commercials drive audiences away. Networks need to know how the length of a break affects viewing patterns and how break positions inside the show affect viewer behavior. Again, a well-calibrated model will help you to understand this.
Statistical and econometric models are the tools more appropriate to understand the effects of different factors in viewing patterns. For daily analysis, networks must embed these models into a production system that can reproduce the analysis time and again.
Step IV. Prediction
It is now time to predict the future. Once decision makers understand the past, they should move forward by predicting ratings. Given the schedule and content available, they will need to construct models that forecast viewing patterns accurately. This is an art and can be quite tricky, because what happened in the past is not necessarily a good predictor of what will happen in the future.
New content will be available, the preferences of the consumers will change, and the viewing pattern will be affected by all of these. Shows can be arranged in a different sequence than in the past; thus, the lead-in and lead-out metrics will be affected. Machine learning and quantitative marketing models are the most appropriate tool to forecast your future audience.
Step V. Prescription
As we have explored, networks have many questions that data science can answer. Networks strive to nudge viewers to keep them engaged. They are seeking to motivate unreached audience, and they are trying to maximize revenues from audience inventory. By equipping experienced schedulers and price negotiators with data science tools, we are empowering organizations to achieve the optimal configuration of their content inventory, connecting networks with consumers and consumers with desired content.
Networks can use mathematical programming models to schedule next week’s shows, maximizing the fore-casted audience and minimizing viewer attrition. A similar model can be used to schedule ads such that the advertisers reach their target goals. Inside the same breaks, the promo must also engage audiences to watch future programing.
Another problem that data science is solving is deciding how much to charge the advertiser for future inventory. A pricing model helps the network design the optimal pricing policy to maximize revenue. Networks can now develop pricing models for their inventory in a similar manner to how airline companies change their ticket prices in real time, considering the competition.
Data science wrap-up
Today in this hypercompetitive environment, with so many channels and platforms, networks are challenged to provide more exciting and attractive content. At the same time, they must use content wisely to entice the largest number of viewers. With these five steps, data science is primed to help networks retain eyeballs. Data science is here to pull the right levers, bringing viewers back to your programming, keeping them away from your competition.
—
Click here to translate this article
Click here to download the complete .PDF version of this article
Click here to download the entire Spring 2017 M&E Journal